

Decoding the YouTube Shorts Algorithm: A Data-Driven Guide to Viral Growth
Article Summary: This guide breaks down key YouTube Shorts metrics like CVR and AVP, offering a data-driven framework for growth. Learn to analyze performance, optimize your content's hook and script, and leverage AI tools to break through view plateaus and go viral on YouTube.

Creating compelling content is just the first step to achieving viral growth and long-term success on YouTube Shorts. To truly thrive, you need a compass—and that compass is data analytics. Data provides an objective look at your video performance, audience preferences, and content weaknesses, empowering you to make precise optimizations and iterate rapidly.
By deconstructing and validating countless viral case studies, we've developed a high-efficiency data analysis framework. This guide will help you move beyond guesswork and unlock true, data-driven content growth.
I. Core Metrics and Essential Tools
In the YouTube recommendation algorithm, certain metrics carry far more weight than others. They are the gatekeepers that determine whether your content breaks into larger traffic pools. Understanding these core metrics and the logic behind them is the foundation of effective analysis.
The platform's primary goal is to maximize user watch time, as over 90% of its revenue comes from advertising. Consequently, the algorithm rewards content that keeps viewers engaged longer, creating more opportunities for ad placements.
1. Key Viewership and Retention Metrics
📌 These are the metrics that matter most for algorithmic success.
| Metric Name (English) |
Core Function & Significance |
|---|---|
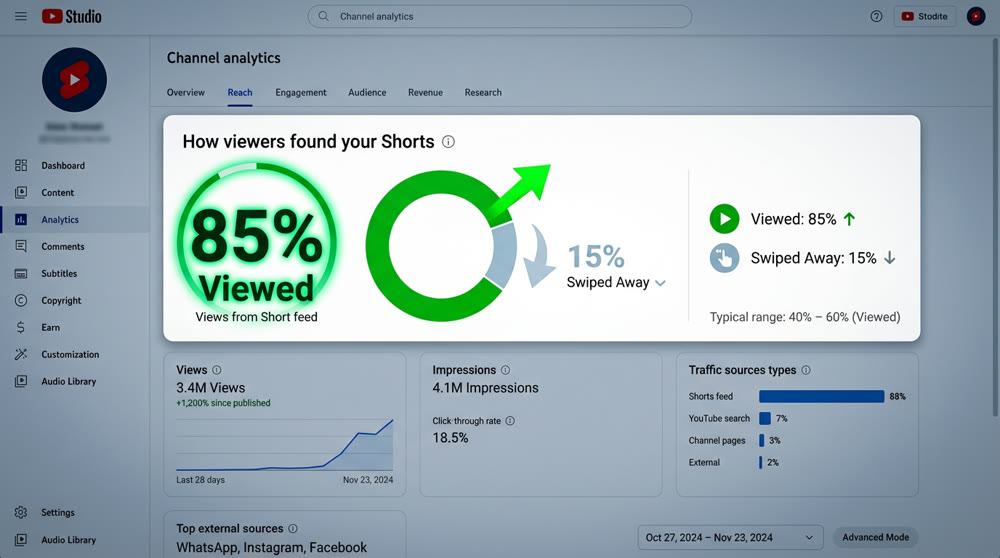
| Viewed vs. Swiped Away | This is the primary indicator that determines if your Short gets recommended. Percentage of viewers who watch instead of swiping. Impact in Shorts feed is immediate and powerful. |
| Average View Duration | Measures the actual amount of time viewers spend watching your video. |
| Average Percentage Viewed (AVP) |
Percentage of your video that viewers watch on average. For Shorts, this metric is extremely important as it reflects the content's initial hook and overall stickiness. |
| Data "Ranking" | Implicit metric measuring your video's relative quality compared to other content in the same niche/category. Determines if your video can stand out in a saturated field. |
Long-Form vs. Shorts: A Different Race
For traditional long-form videos, YouTube prioritizes total watch time and retention, making it a marathon. In contrast, Shorts are a sprint. The algorithm heavily favors the "Viewed vs. Swiped Away" rate and Average Percentage Viewed (AVP), rewarding content that can capture and hold attention in the shortest possible time.
2. Revenue and Engagement Metrics
While interaction rates (subscribers, comments, likes) are important for long-term channel health, they are less critical than viewership metrics during the initial push for a viral Short. However, they become vital for community building and monetization.
- Revenue Metrics: RPM (Revenue Per Mille) or CPM (Cost Per Mille) measures your earnings per 1,000 views. This figure is heavily influenced by your audience's geography (ad rates in developed countries are much higher) and your content niche (high-value topics attract more expensive ads).
- Interaction Metrics: Subscriber rates, comment rates, and like rates help build audience loyalty and increase your channel's long-term authority.
3. Official and Third-Party Analytics Tools
Successful creators leverage a variety of tools to get a complete picture, from macro trends and competitor performance to granular video data.
| Platform Type |
Tool Name | Key Function & Use Case |
Link |
|---|---|---|---|
| Official Platform | YouTube Studio | Official dashboard for managing videos, tracking views, subscriber growth, revenue reports, and analytics |
- |
| Data Analysis | ViewStats | Detailed channel & video analytics. Find top-performing channels/videos, filter by region/content type, identify viral trends. Essential for inspiration |
ViewStats |
| SEO & Competitive Analysis | vidIQ | Browser extension & mobile app. Full suite for channel optimization. Keyword explorer (search volume/competition), bulk actions, competitor tag insights |
vidIQ |
| Revenue & Growth Tracking | Social Blade | Analytics platform providing detailed data on subscriber growth, view counts, estimated earnings. Good for competitor benchmarking |
Social Blade |
| Trend Discovery | Google Trends | Free Google tool for global/local search trends. Helps discover trending topics, optimize video ideas & titles, capture waves of user interest |
Google Trends |
II. Data Benchmarks for a Viral YouTube Short
To achieve explosive growth with Shorts, aiming for "average" data is not enough. Viral videos meet clear, even demanding, data thresholds, especially for the "Viewed vs. Swiped Away" rate and Average Percentage Viewed.
1. The "Hard Metrics" for Going Viral
Data shows that to break through YouTube's invisible "50,000-view ceiling"—a common plateau for many creators—your video needs to hit these benchmarks:
- Viewed vs. Swiped Away Rate:
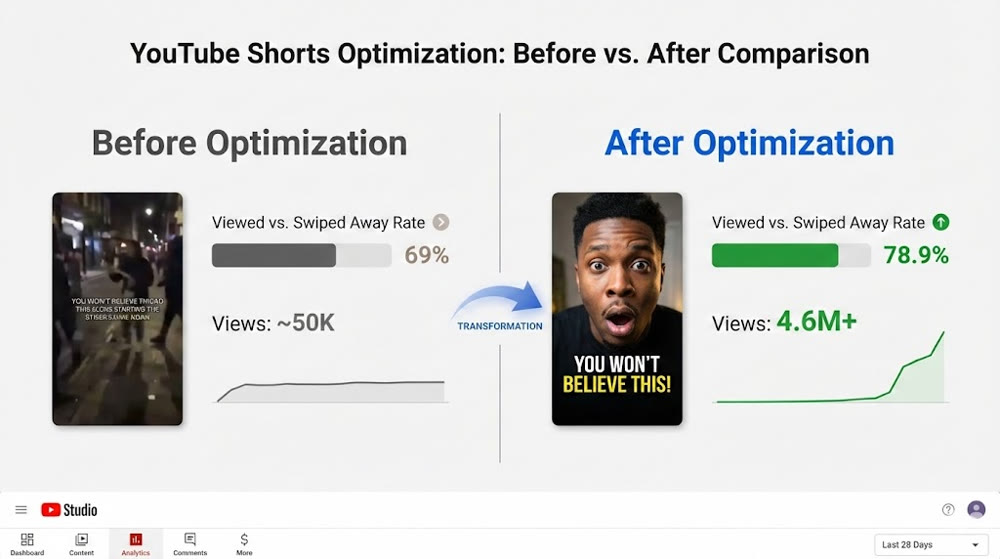
- For viral hits with tens of millions of views, this rate must typically be above 80%.
- In one real-world case, a creator optimized a video to increase this rate from 69% to 78.9%, leading to a significant boost in views. However, breaking into the 10-million-view club often requires hitting that 80%+ mark.
- Average Percentage Viewed (AVP):
- Because the Shorts player loops videos, a great AVP can easily exceed 100%, often reaching 120% or even higher.
- For a ~15-second video, you need an average view duration of 21+ seconds (an AVP over 140%).
- For a ~20-second video, an AVP above 140% is a strong signal.
- For a ~30-second video, an AVP over 120% is considered excellent.
💡 Remember: Viewers would rather watch a 30-second video twice than a 60-second video once. A high AVP is a critical signal to the algorithm to keep promoting your content.
To help you quickly assess your Shorts' potential, consult the following benchmarks for "Viewed vs. Swiped Away" and "Average Percentage Viewed (APV)" across different video durations.
These are critical indicators that YouTube's algorithm prioritizes for pushing content to a wider audience.
Benchmarks by Video Duration
| Video Duration | Metric | Good | Great | Viral Potential |
|---|---|---|---|---|
| < 15 seconds | Viewed vs. Swiped Away Rate | > 70% | > 75% | > 80% |
| Average Percentage Viewed (APV) | > 110% | > 125% | > 140% | |
| 15–30 seconds | Viewed vs. Swiped Away Rate | > 65% | > 70% | > 78% |
| Average Percentage Viewed (APV) | > 100% | > 110% | > 120% |
Viral "Hard Metrics"
Data shows that if your video aims to break through YouTube's invisible "50,000-view wall"
(i.e., the "hitting the 10K view wall" curse), it needs to meet the following benchmarks:
** Selection Rate (CTR)**
- For viral hits reaching tens of millions of views, the selection rate typically needs to be above 80%.
- In actual cases, some creators optimized CTR from 69% → 78.9%, leading to significant view growth,
but still needed to exceed 80% to reach multi-million view thresholds.
Average Percentage Viewed (APV)
- Since the Shorts platform encourages re-watching, excellent short videos often have an APV > 100%,
reaching 120% or higher. - For 15-second videos: average watch time > 21 seconds (APV > 140%).
- For 20-second videos: APV needs to be above 140%.
- For 30-second videos: completion rate > 120% is considered excellent.
💡 Tip: Viewers are more willing to watch a 30-second video twice than a 60-second video once.
A high APV is usually a key signal for the platform to continue promoting your content.
2. The Golden Opening: The 3-Second Rule
In the fast-paced Shorts feed, viewer attention is scarce. The first 3 seconds of your video are what determine your "Viewed vs. Swiped Away" rate.
According to YouTube algorithm experts, a Short must grab the viewer's attention from the very first frame. You need to build immediate tension or curiosity, or the viewer will likely swipe away within 2 or 3 seconds, killing your video's momentum.
✨ Technique: If your "Viewed vs. Swiped Away" rate is low, the problem is almost always the "packaging"—the first 3 seconds of content, your IP/character design, visual style, or screen brightness.
III. Data-Driven Strategies for Analysis and Optimization
Efficient creators don't get stuck on failing content; they learn quickly from the data and apply those lessons to their next iteration.
1. The Rapid Review and Iteration Cycle
In a competitive content landscape, speed is of the essence.
- The 3-Hour Review Window: Many top creators check their data within the first 3 hours of publishing. This initial period is often a strong predictor of a video's potential to go viral.
- Make Decisive Cuts: If the initial data (especially the "Viewed vs. Swiped Away" rate) is poor (e.g., below 75%), you need to act. A friend shared a case where a video with a 69% rate was optimized by removing a few unnecessary special effects. The rate immediately jumped to 78.9%, and the video went on to get 4.6 million views. Without that quick optimization, a viral opportunity would have been lost.
- Embrace Objectivity: Data is the most objective critic of your work and the clearest guide to what needs fixing.
2. The Three Pillars of Breaking the View Plateau
Getting stuck under 50,000 views is a common frustration. The path to breaking through focuses on three core elements: Packaging, Script, and Relative Quality.
2.1. Optimize the "Packaging" (To Increase Viewed vs. Swiped Away Rate)
- Your content's packaging is what makes viewers stop scrolling. It’s your hook.
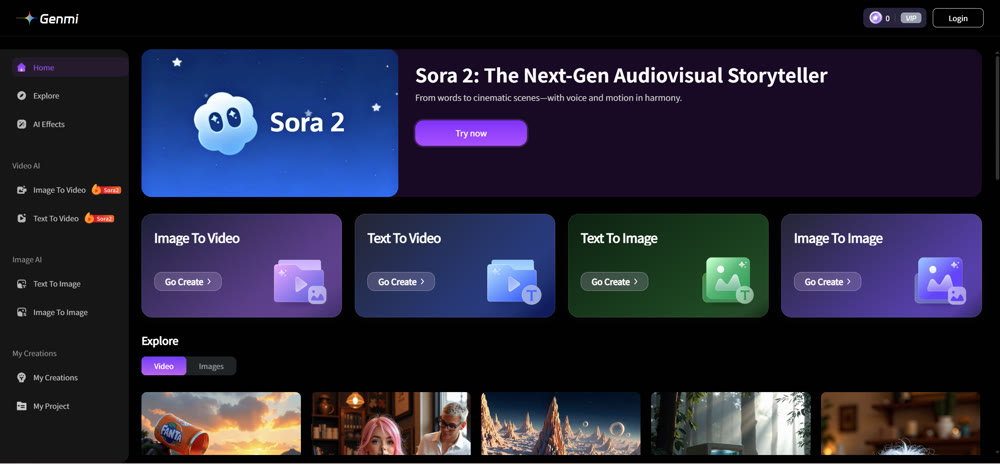
- Polish the First 3 Seconds: Make your opening visually stunning or intensely intriguing. Creating eye-catching animated visuals from a simple prompt is easier than ever with AI. Tools like Genmi AI's text-to-video generator can help you quickly visualize and test different opening concepts.
- Image Quality & Brightness: Ensure your visuals are clean and stylistically consistent. Pay close attention to brightness—bright, well-lit scenes are generally more appealing to viewers. Avoid dark or murky settings.
2.2. Improve the "Script" (To Increase AVP)
- The script is the internal driver of your content and directly impacts how long viewers stay.
- Story Structure & Pacing: Examine your video's entire story structure, shot composition, and rhythm. Story-driven content often fails due to a weak script.
- Play to Your Strengths: Live-action videos that rely heavily on nuanced acting or subtle expressions are difficult to replicate with AI, as current models struggle with complex human emotion, which can disengage viewers and lower AVP. Instead, prioritize scripts with strong plots and clear, impactful moments.
2.3. Elevate "Relative Quality" (To Stand Out in a Saturated Niche)
In a crowded niche, your relative quality determines where your content ranks among competitors.
- Differentiate with Micro-Innovations: Even when replicating a viral format, introduce a small twist. Try swapping out the main character (IP), changing the setting, or presenting it in a different visual style. Transforming a static character image into a dynamic video with something like Genmi AI's image-to-video tool can be a powerful way to innovate.
- Learn Through Controlled Variables (Advanced): Systematically analyze what makes viral content in your niche work. Identify the constant "core" (the story structure) and the "variables" you can change (the characters, the setting). This allows you to innovate reliably.
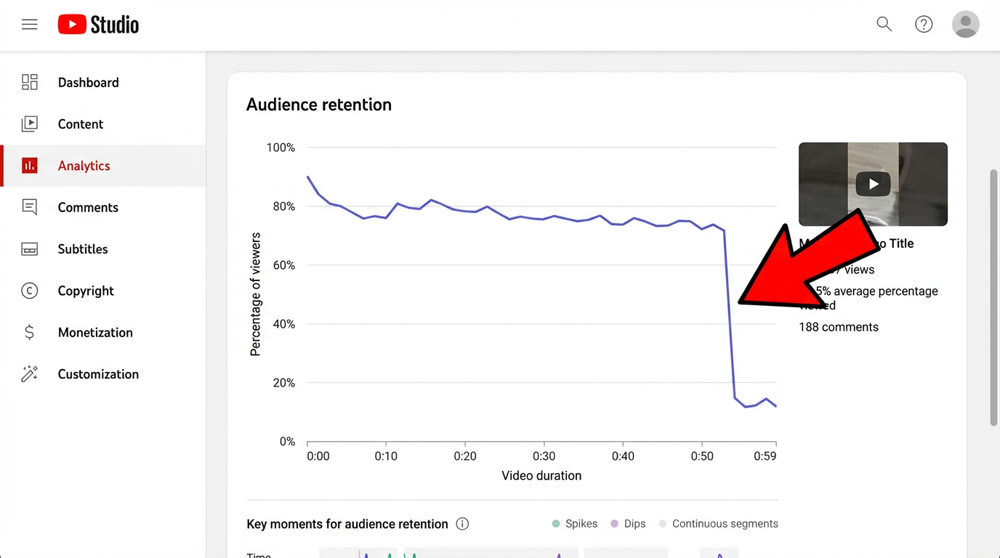
- Analyze the Viewer Engagement Curve: YouTube Studio's engagement curve is a powerful diagnostic tool.
- Find the Drop-Offs: Look for the exact moments in the timeline where you see a "sharp cliff" in viewership.
- Diagnose the Problem: Match that timestamp to the specific shot or plot point in your video. Was the story unclear? Was the pacing too slow? Did the character's performance fall flat? Use this insight to make targeted adjustments.
- Optimize the Ending for Repeat Views: The most direct way to boost AVP is to encourage loops.
- Keep the End Short: The final shot should be as brief as possible. Any fluff or drawn-out endings will hurt your AVP.
- Design a Seamless Loop (Advanced): Top-tier creators design the final frame of their video to blend perfectly with the first frame. Viewers don't even realize the video has restarted, naturally boosting AVP. For more on this and other advanced techniques, explore our guide to AI-powered YouTube Shorts growth hacks.
- AI-Assisted Analysis: Turn AI into your personal data expert. Powerful AI models can directly analyze your backend data to accelerate your workflow.
- AI Diagnostic Tools: You can upload screenshots of your YouTube analytics (like the engagement curve or CVR data) directly to advanced AI models like Google's Gemini 2.5 Pro (via AI Studio) for a comprehensive review.
- Analysis & Optimization: AI can help summarize viral elements, pinpoint weaknesses, and provide actionable optimization plans, drastically reducing your learning curve.
- Recommended Tool: Google's AI Studio offers free access to Gemini 2.5 Pro and supports image and video uploads for analysis. Try it on AI Studio.
By combining rigorous data analysis with a rapid iteration cycle, you can move from manual content creation to a powerful, data-driven growth engine. This is the key to consistently producing viral hits and achieving your revenue goals in the competitive world of AI-generated content on YouTube.
Ready to put these data-driven principles into practice? The next wave of content creation is powered by AI that understands what makes content viral. Genmi AI provides the tools you need to create stunning, high-retention video content at scale. Stop guessing and start creating with data-backed confidence. Explore Genmi AI today and turn your insights into your next viral hit.
Recommended Articles
YouTube Monetization Unlocked: A Deep Dive into YPP and Shorts Revenue for AIGC Creators
Unlock YouTube monetization with our deep dive into YPP, Shorts revenue, and RPM. Learn AIGC strategies to grow your channel and maximize earnings. Start now!

The Viral YouTube Shorts Formula: An AI Creator's Guide
Unlock the secrets to viral YouTube Shorts. Our guide covers the algorithm, scriptwriting, and AI tools to get millions of views. Start creating viral content .

An In-Depth WAN 2.2 Review: Redefining AI Video Motion Control
Explore our WAN 2.2 review. We analyze its advanced motion control, prompt accuracy, and how it compares to other top models in the AI video space.